

There’s no doubt that data is both a consequence and a catalyst of our digital age. It’s becoming increasingly relied upon to investigate deeper into findings and to transform big data into big insights. As such, content is enhanced and underpinned by the science behind these big insights. Such insights can often be mightily complex – which is where data visualization comes into play. It enables decision-makers to explore visually presented analytics, in the form of statistical graphs, plots, and infographics, to grasp challenging concepts and appreciate new patterns and results.
If information makes the world go round, the Earth must be spinning. According to IBM, the world collectively creates 2.5 quintillion bytes of data each day. Big Data accounts for the sheer enormity of information that users generate every second, both online and off. With such capacity comes a massive opportunity to collect, analyze, and utilize data to further interests in almost every field and industry imaginable.
Revenue from big data is expected to grow to as much as $275B in 2022.
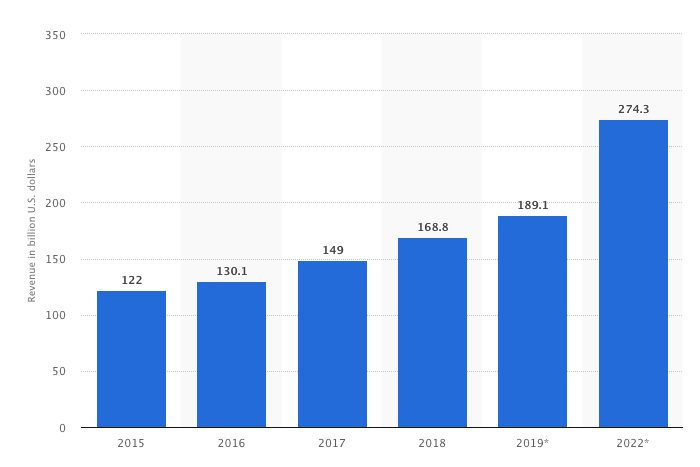
Image source: Statista
As far as content and data visualization goes, it’s reasonable to suppose that without big data, very limited value could be attached to the sentiment of any content – and practically none to that of data visualization, and here’s why.
Big Data Big Content
A powerful big-data system will collect, analyze, and manage data to enable the manipulation of information that uncovers a variety of social dynamics and consumer insights – which in turn, allow for bigger and better content. The creation of content culled from in-depth research using big data allows content creators to address what, how, and when their consumers want to digest, in real-time.
In other words, big data collects and organizes statistics on the demographics of your chosen audience. Information on age, gender, employment, interests, and content consumption habits provides a way for content strategists to identify what their audience finds relevant and interesting. By converting this data into user-friendly, engaging content, crafted around the wants and needs of your audience, you are already ahead of those who neglect big data. In fact, a 2018 survey revealed that data-driven content campaigns were more than 23 times more likely to acquire customers and 6 times more likely to retain them.
In the very same 2018 survey, a certain 92% of marketing professionals recognized personalization to be a critical element in enhancing the customer experience. Nothing possesses the ability to personalize content quite like big data, given its capacity to delve into every stage of the consumer journey. With this, the risk of producing and circulating irrelevant and misguided content is minimized, allowing for a greater return on content investment.
Big data plays a fundamental role in identifying both your Most Valuable People (MVP) for whom your content should be targeted and how to retain them. It does so by deducing and mapping how long a prospective customer stays in the sales cycle and helps to determine what type of content will convert them. By analyzing this information, companies can easily make use of the crucial insights to seamlessly achieve their goals. For example, customer retention strategies should evolve out of analyzing big data metrics like:
- Number and growth rate of subscribers;
- Average time spent on the website;
- Click-through rate;
- Customer satisfaction;
- Email open rate.
Big Data and Real-Time Content Usage
Data-output and generation of information are taking place at an unprecedented pace. As such, time-sensitive industries should take advantage of real-time analytics, as the capacity to use data as soon as it enters the big data system. Many businesses and brands today recognize the importance of continuously circulating relevant content to support their position in the market. A continuous flow of content should be close to consistent with the continuous frequency in which data is collected. Google has launched its real-time data product, Real-time Content Insights (RCI) for journalists and content creators to identify trending news stories and gain more traction. It gathers data already collected through Google Analytics and makes it more useful and accessible for less tech-savvy publishers of content. Across all industries, the ability to produce content with real-time updates can be a game-changer when it comes to beating the competition and establishing an industry-leading position.
Big Data, Direction, and Substance
Big Data helps to give your content direction and substance. There’s no denying that sharing credible, trustworthy, and data-packed content helps to attract and retain customers. If a brand is held accountable for the information it shares, a reputation for poor quality and unsupported content will do business no favors in materializing its goals. Rather, aim to be as specific as the data allows. Lisa Box, VP of Strategic Alliances at WP Engine expands on how to do this effectively. They use a variety of data sources to identify the Total Addressable Market in order to locate the companies that have similar technology, are in the right geographical locations, and identify with the industries which WP Engine serves. Using this information, they create digital campaigns with content that fit the customer’s needs the best.
Visualizing Big Data
Big Data is predominantly collected in the form of statistics, codes, and machine learning techniques. All of which can be better appreciated as represented in data visualization – offering the non-statistician an understandable and digestible grasp of the data through visual aids. Big Data visualization goes way beyond general corporate graphs, pie charts, and histograms to more complex representations of information, like heat maps, visuals of electricity consumption around the world, and practically anything else that can be displayed in a more artistic format that veers away from hundreds of rows, columns, and graphs.
Data visualization implements these contemporary visuals to illustrate relationships within a data set, that allow decision-makers to identify correlations or unexpected patterns. The use of data visualization operates on a reciprocal basis and can be beneficial to the business and its consumers. Gone are the days of invasive advertising and push-to-sell campaigns. More than ever, consumers are now interested in learning about the brand they’re investing in and are 71% more likely to be turned off by content that seems like a sales pitch (Economist Group: Missing the Mark). This is one explanation for the increasing importance of content marketing. Making use of Big Data in creative visual formats gives customers more information on which to base their purchasing decisions.
Infographics have become a superfluous yet static phenomenon in the marketing arena. They incorporate extensive information into visually stimulating and digestible pieces of content but often fail to embrace actual visual accounts of what a data set represents.
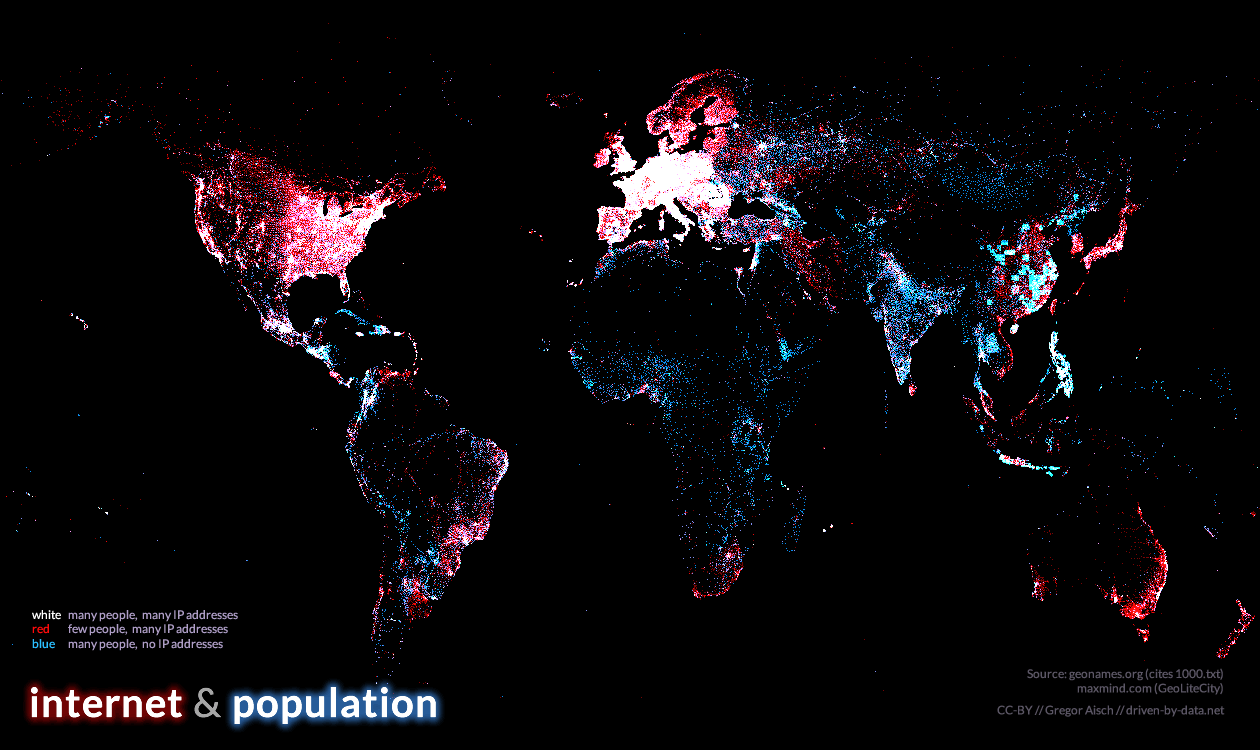
Image Source: One
The image above shows a data visualisation worldview of the relationship between the internet and the population. It’s indicative of how many people there are to how many IP addresses exist in a given location and immediately shows an inherent problem with underdevelopment. From here, inferences and interpretations can be made within seconds. The point is well made and delivered in an easy to digest format like no other. This image was only made possible through Big Data sets and invites us to examine the variables in a new light.
Image source: NASA